GSK PLC
Supplier Financial Health Report
Overview
June 2024
GB
Incorporated Country
70,212
Number of Employees
2
Number of Funding Rounds
26
Count of Investments
Five-Year Financial Trend Analysis for GSK PLC
--
Credit Trend
-2.80%
Total Balance Sheet Growth Rate
-12.01%
Total Debt Growth Rate
However, the balance sheet trend showed a decrease, dropping from $109.87B in 2020 to $106.79B in 2021, which is a 2.80% change. This decrease in total assets could be a cause for concern, as it may indicate a reduction in the company's overall financial resources.
The cash trend also showed a decrease, dropping from $6.25B in 2019 to $5.77B in 2021, representing a 7.63% change. This decrease in cash could impact the company's ability to meet its short-term obligations and invest in future growth opportunities.
Despite the decrease in cash, the total debt trend showed a significant decrease, dropping from $37.09B in 2020 to $32.63B in 2021, representing a 12.01% change. This reduction in debt is a positive sign, as it indicates the company's ability to reduce its financial obligations and improve its financial position.
The liabilities trend also showed a decrease, dropping from $81.45B in 2020 to $77.98B in 2021, representing a 4.26% change. This decrease in liabilities is a positive sign, as it indicates the company's ability to reduce its financial obligations and improve its financial position.
The stockholders equity trend showed an increase, rising from $24.36B in 2019 to $28.81B in 2021, representing an 18.28% change. This increase in equity is a positive sign, as it indicates the company's ability to generate profits and retain earnings for future growth.
The net income trend showed a decrease, dropping from $6.73B in 2019 to $6.03B in 2021, representing a 10.31% change. This decrease in net income could impact the company's ability to generate profits and invest in future growth opportunities.
The EBITDA trend showed a decrease, dropping from $8.98B in 2019 to $8.53B in 2021, representing a 5.07% change. This decrease in EBITDA could impact the company's ability to generate earnings before interest, taxes, depreciation, and amortization, which could impact its financial performance.
The net operating cash flow trend showed an increase, rising from $12.17B in 2019 to $12.72B in 2021, representing a 4.49% change. This increase in net operating cash flow is a positive sign, as it indicates the company's ability to generate cash from its core operations.
The capital expenditures trend showed a decrease, dropping from $1.49B in 2019 to $1.42B in 2021, representing a 5.23% change. This decrease in capital expenditures could impact the company's ability to invest in future growth opportunities and maintain its infrastructure.
The free cash flow trend showed an increase, rising from $10.68B in 2019 to $11.3B in 2021, representing a 5.85% change. This increase in free cash flow is a positive sign, as it indicates the company's ability to generate cash after accounting for capital expenditures and taxes.
GSK PLC's revenue growth trend is a positive sign, but the decrease in cash, net income, and EBITDA could impact the company's financial performance and ability to invest in future growth opportunities. The reduction in debt and liabilities is a positive sign, but the decrease in stockholders equity could be a cause for concern. Overall, the company's financial health appears to be stable, but there are some areas for improvement.
It is important to note that there are several missing data points, including credit rating, credit score, credit trend, number of employees, short-term investments, and operating cash flow per share. Without this information, it is difficult to provide a comprehensive assessment of the company's financial health.
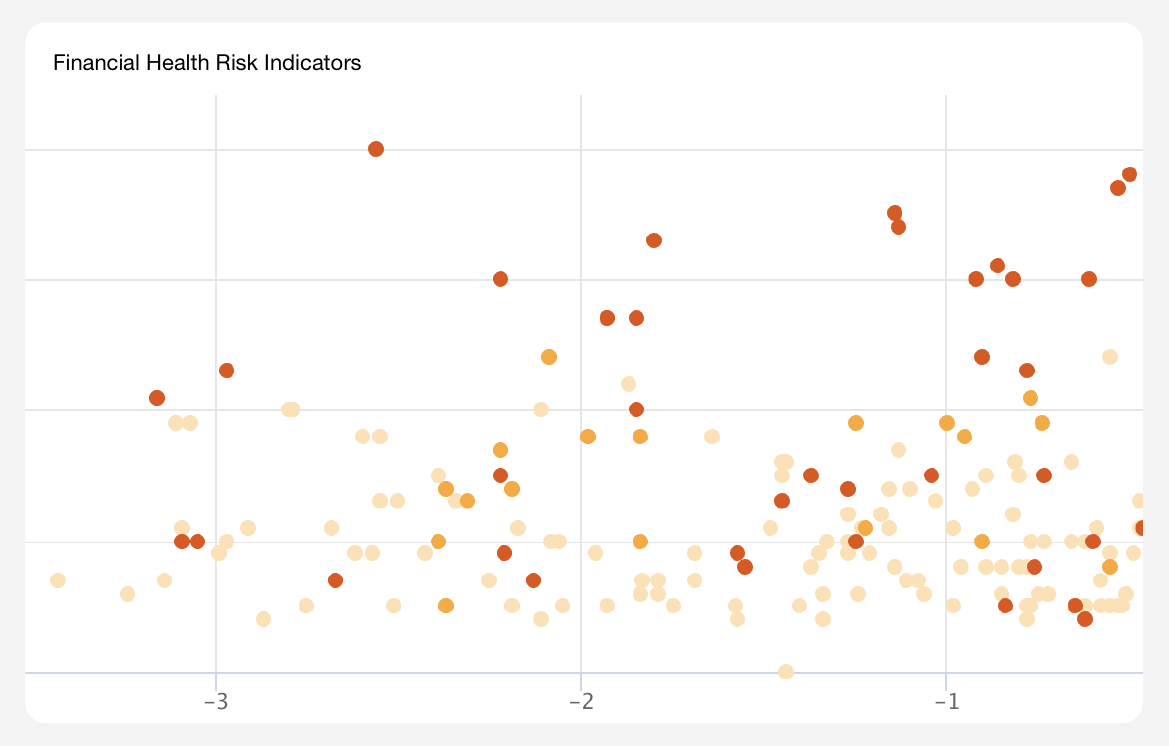
Financial Health Risk Assessment for GSK PLC
LOW
Profitability Risk
MEDIUM
Solvency Risk
HIGH
Financial Health Risk
The balance sheet trend showed a decrease in total assets from $109.87 billion in 2020 to $106.79 billion in 2021, which is a 2.80% change. This decrease could be a cause for concern, as it may indicate a reduction in the company's overall financial resources. Additionally, the cash trend decreased from $6.25 billion in 2019 to $5.77 billion in 2021, representing a 7.63% change. This decrease in cash could impact the company's ability to meet its short-term obligations and invest in future growth opportunities.
Despite the decrease in cash, the total debt trend showed a significant decrease, dropping from $37.09 billion in 2020 to $32.63 billion in 2021, representing a 12.01% change. This reduction in debt is a positive sign, as it indicates the company's ability to reduce its financial obligations and improve its financial position. The liabilities trend also showed a decrease, dropping from $81.45 billion in 2020 to $77.98 billion in 2021, representing a 4.26% change. This decrease in liabilities is a positive sign, as it indicates the company's ability to reduce its financial obligations and improve its financial position.
However, the net income trend showed a decrease from $6.73 billion in 2019 to $6.03 billion in 2021, representing a 10.31% change. This decrease in net income could impact the company's ability to generate profits and invest in future growth opportunities. The EBITDA trend also showed a decrease, dropping from $8.98 billion in 2019 to $8.53 billion in 2021, representing a 5.07% change. This decrease in EBITDA could impact the company's ability to generate earnings before interest, taxes, depreciation, and amortization, which could impact its financial performance.
The net operating cash flow trend showed an increase, rising from $12.17 billion in 2019 to $12.72 billion in 2021, representing a 4.49% change. This increase in net operating cash flow is a positive sign, as it indicates the company's ability to generate cash from its core operations. The free cash flow trend also showed an increase, rising from $10.68 billion in 2019 to $11.3 billion in 2021, representing a 5.85% change. This increase in free cash flow is a positive sign, as it indicates the company's ability to generate cash after accounting for capital expenditures and taxes.
In summary, while GSK PLC's revenue growth trend is a positive sign, the decrease in cash, net income, and EBITDA could impact the company's financial performance and ability to invest in future growth opportunities. The reduction in debt and liabilities is a positive sign, but the decrease in stockholders equity could be a cause for concern. Overall, the company's financial health appears to be stable, but there are some areas for improvement. It is important to note that there are several missing data points, including credit rating, credit score, credit trend, number of employees, short-term investments, and operating cash flow per share, which could provide additional insights into the company's financial health. Further investigation into these areas may be necessary to gain a more comprehensive understanding of the company's financial situation.
List of UEIs for GSK PLC
ABOUT SUPPLIER FINANCIAL HEALTH REPORTS
Ark provides definitive, consolidated analyses of every vendor, subcontractor, supplier, grant awardee, non-profit, and investment organization in the national security and defense sectors. Supplier financial health reports are AI-assisted analyses of the current health and stability of an organization, as well as the trends, trajectory, and risk indicators that partners and stakeholders need to know about.
Explore Additional Analyses
ABOUT ARK.AI
The Ark is the only software platform purpose-built for Defense Acquisition that leverages authoritative commercial data and AI-enabled Applications designed to solve Acquisition challenges. With the Ark, analysts and decision-makers gain the ability to manage Acquisition programs proactively, allowing them to unwind the legacy complexity and effectively field modern warfighting systems that compete with China.
The Leading Defense Acquisition Software.


OUR APPLICATIONS
AI-enabled Applications within The Ark reflect standard workflows across the Defense Acquisition Process. From Science & Technology to Modernization, these Applications allow for the execution of rapid, efficient, data-informed decisions, standardized reporting, and efficient workflow management. The Ark enables your team to transform Defense Acquisition into a strategic advantage.