General Electric Company

Supplier Financial Health Report

Overview

June 2024

USA

Incorporated Country

125,000

Number of Employees

A+

Credit Rating

44

Count of Investments

General Electric Company, founded in 1892 and headquartered in Fairfield, Connecticut, is a globally recognized business conglomerate with a workforce of 125,000 employees. The company's operations span across various industries, including electronics, energy, energy management, finance, and manufacturing. General Electric offers a diverse range of products and services through its segments such as power and water, oil and gas, energy management, aviation, healthcare, transportation, appliances and lighting, and GE capital. General Electric Company's CEO is H Lawrence Culp Junior. The company has a credit rating of A+ and a credit score of 97, with a constant credit trend.

Five-Year Financial Trend Analysis for General Electric Company

CONSTANT

Credit Trend

-71.12%

Total Balance Sheet Growth Rate

-76.78%

Total Debt Growth Rate

Based on the provided financial data for General Electric Company, the company has experienced a significant decrease in annual revenue and balance sheet size over the past 5 years. The revenue dropped from $97.01B in 2018 to $58.1B in 2022, representing a 40.11% change. Similarly, the balance sheet size decreased from $653.93B in 2014 to $188.85B in 2022, which is a 71.12% change. The cash trend also showed a decrease, dropping from $70.02B in 2014 to $15.81B in 2022, a 77.42% change.

Despite these declines, the company's credit rating remains strong with an A+ rating, and its credit score is excellent at 97. The credit trend is constant, indicating a stable financial position. The company has had 8 funding rounds, raising a total of $8.29B, and has made 44 investments. It has had 18 exits, suggesting an active approach to investments and exits.

The net income trend showed a significant decrease, dropping from $15.34B in 2014 to $407M in 2022, a 97.35% change. However, the EBITDA trend showed an increase, rising from -$14.4B in 2018 to $2.1B in 2022, a 114.60% change. The net operating cash flow trend showed a decrease, dropping from $27.71B in 2014 to $5.92B in 2022, a 78.65% change. Capital expenditures also decreased from $2.85B in 2018 to $968M in 2022, a 66.08% change. However, free cash flow increased from $2.12B in 2018 to $4.95B in 2022, a 132.96% change.

The company operates in various segments, including power and water, oil and gas, energy management, aviation, healthcare, transportation, appliances and lighting, and finance. It has a significant international presence, with China, Japan, Germany, India, the United Kingdom, France, Italy, the Russian Federation, Canada, and Brazil being the top countries contributing to its revenue.

In conclusion, while General Electric Company has experienced significant declines in revenue, balance sheet size, and net income over the past 5 years, its credit rating and score remain strong, and it has a stable financial position. The company's active approach to investments and exits, along with its strong credit position, suggest that it may be in a position to rebound in the future. However, the declining trends in key financial metrics should be closely monitored.

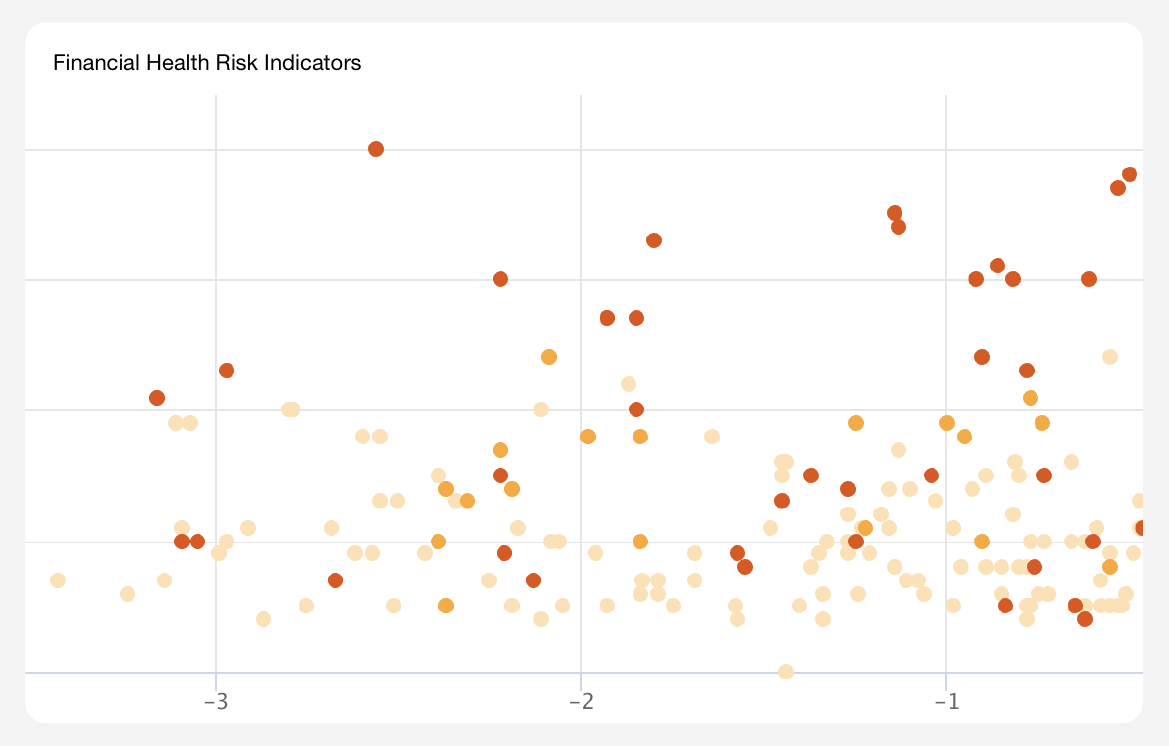
Financial Health Risk Assessment for General Electric Company

LOW

Credit Risk

LOW

Bankruptcy Risk

MEDIUM

Financial Health Risk

General Electric Company has experienced significant declines in its financial metrics over the past five years, with revenue dropping by 40.11% to $58.1B, balance sheet size decreasing by 71.12% to $188.85B, and net income falling 97.35% to $407M. Despite these declines, the company's credit rating and score remain strong, with an A+ rating and an excellent credit score of 97, indicating a stable financial position. The company has been actively involved in investments and exits, raising a total of $8.29B and making 44 investments, but the net income trend and decreasing cash trend should be closely monitored. The profitability margins are relatively low, and the return on assets and equity ratios are 0. The debt-to-equity ratio of 4.41 indicates that the company has been using more debt than equity to finance its operations, which could be a concern if interest rates rise or if the company experiences financial difficulties. The Altman Z-Score of 3.26 suggests a low probability of bankruptcy within the next two years, but it should not be the sole indicator of a company's financial health. Overall, the company's financial health shows a medium risk level, with areas of concern regarding profitability and the use of debt to finance operations. It's important for investors and stakeholders to keep a close eye on these trends and consider seeking professional advice before making any significant financial decisions.

List of UEIs for General Electric Company

HBJLPLNB5B16, ZVMTCAY4LHL9, U864F3HRME53, ZD5NZK91NS47, CJP3G3AGVEJ7, LQM3MKB9GW35, HVQDMNA1GG18, VTALDFW49638, KGMAGNJB8B55, JLNCT3GFY7L9, NVMPD1DXDU77, L5W8B6Z6N422, DC2SQJCHC941, EH9KJHGT19T3, CLNAX4LBHCT7, YH3CKLY36T18, L151KBDAENG1, GE9QTM62ECY3, GLW6HHK4F3M3, KDHNLSCRN8S8, MW8JAMZB7M87, M2FYKG7HP723, JGUJLVZQ4M11, M9XJL4JBGN45, EF5CK4DHMCX7, DJY8WLTGF577, HBLRJ28LNM16, DNFHD1G8LNW9, N3ZALYFTKJM8, MMC3JYNDLMW6, HVK6DCBLUCP7, K5HMX2RJYR53, LGXXE8T6ECL8, ZFPKQ7L6T884, G8ZDCJBXJXR8, UKHNVMNKFD36, ZQR8DTH23ZR5, ULMMYLB8X2J1, QEMQT5K1XA25, NDZNF9EW7NP7, TWA8Z4ANM3Y4, JFEEKCSN33B5, MJ3MQ2P8EYE5, H46STXEYLCC3, EYBBNJYZ5H21, KAJUKQ3SH354, LJA3MQRD7CF8, E3HYKKLT5ZT1, T6FWWKR1WXT9, UQJRPM3V5K38, GZPCVLPT14M2, GFJNMHZW78T6, FH5SUL9BKM69, LZYJC42JTNT9, FBXVANJWUL78, YKR5JY6K3UX6, P6M6L6AKMZA7, D6LKUFHMHJ31, MCVLPSTDHLL9, ECREKDEN5NN6, JTT8B2QKM8C3, LL1BA9A7FN25, J1T1FEN3PWX6, C7X2U84J6GE1, RX1ZPAYG83N9, RMVNBSV7D4H3, F5XNHEBEE7J2, VL6RR3BEMUM9, E8ZJJFT33FK8, EN6DL3N4RHG6, CJ3LHGDB75X5, JRZ1WHXAKBM3

ABOUT SUPPLIER FINANCIAL HEALTH REPORTS

Ark provides definitive, consolidated analyses of every vendor, subcontractor, supplier, grant awardee, non-profit, and investment organization in the national security and defense sectors. Supplier financial health reports are AI-assisted analyses of the current health and stability of an organization, as well as the trends, trajectory, and risk indicators that partners and stakeholders need to know about.

ABOUT ARK.AI

The Ark is the only software platform purpose-built for Defense Acquisition that leverages authoritative commercial data and AI-enabled Applications designed to solve Acquisition challenges. With the Ark, analysts and decision-makers gain the ability to manage Acquisition programs proactively, allowing them to unwind the legacy complexity and effectively field modern warfighting systems that compete with China.

The Leading Defense Acquisition Software.

Army SealASN SealCyber SealDLA SealDOD SealNavy SealAirforce SealDISA Seal

OUR APPLICATIONS

AI-enabled Applications within The Ark reflect standard workflows across the Defense Acquisition Process. From Science & Technology to Modernization, these Applications allow for the execution of rapid, efficient, data-informed decisions, standardized reporting, and efficient workflow management. The Ark enables your team to transform Defense Acquisition into a strategic advantage.

Army Seal