CGI Inc
Supplier Financial Health Report
Overview
June 2024
CA
Incorporated Country
91,000
Number of Employees
7.36
Altman Z-Score
--
Count of Investments
Five-Year Financial Trend Analysis for CGI Inc
--
Credit Trend
21.14%
Total Balance Sheet Growth Rate
70.46%
Total Debt Growth Rate
CGI's cash position also saw a significant improvement, rising from $132.6M in 2017 to $702.81M in 2022, a 430.03% increase. However, the company's total debt and liabilities also increased during this period, with total debt rising from $1.39B in 2018 to $2.38B in 2022, a 70.46% change, and liabilities increasing from $4.05B in 2018 to $5.75B in 2022, a 41.87% change.
Despite the increase in debt and liabilities, CGI's net income and EBITDA also showed significant growth, rising from $788.72M in 2017 to $1.15B in 2022, a 45.55% change, and from $1.52B in 2018 to $1.98B in 2022, a 30.14% change, respectively. The company's net operating cash flow also increased from $1.04B in 2017 to $1.46B in 2022, a 41.08% change.
CGI's revenue is diversified across several countries, with France, Canada, the United Kingdom, Germany, Finland, Sweden, the Netherlands, Norway, Spain, and Portugal accounting for 16%, 16%, 11%, 7%, 6%, 5%, 4%, 1%, 1%, and 1% of the company's revenue, respectively.
Although there is no credit rating, credit score, credit trend, number of funding rounds, total funding amount, number of investments, number of exits, number of employees, or other financial data provided, the available data suggests that CGI Inc is a financially healthy company with a strong revenue growth trend and a growing balance sheet.
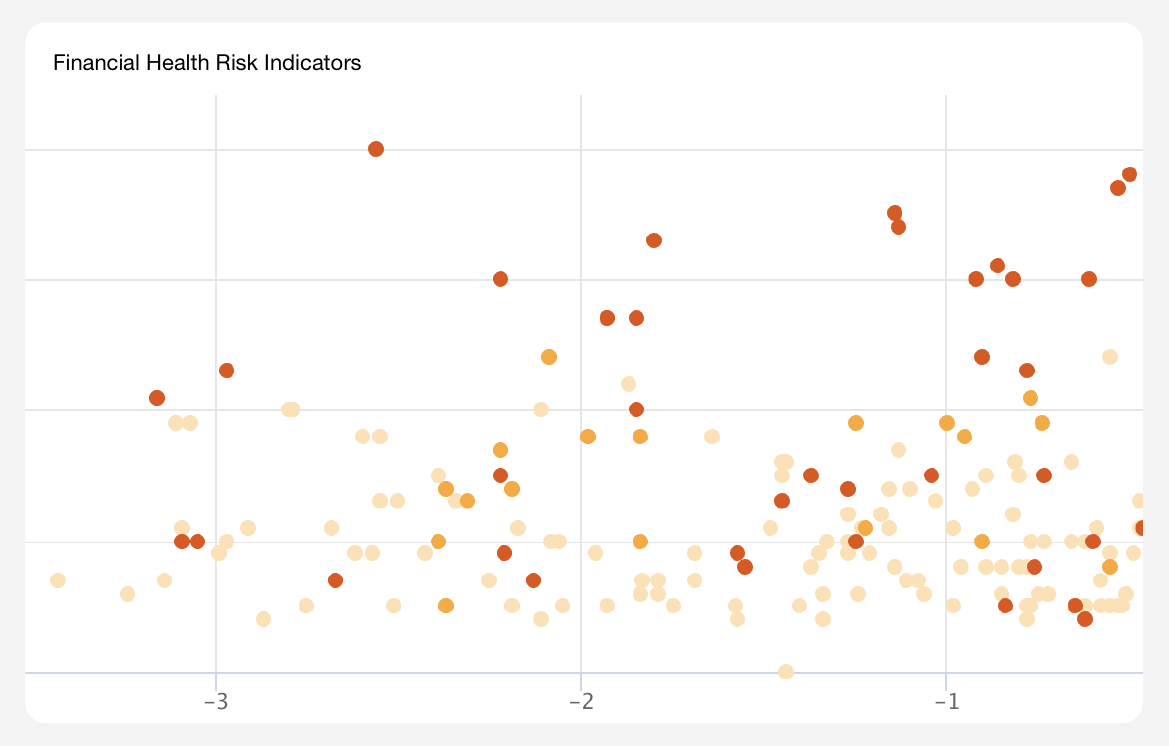
Financial Health Risk Assessment for CGI Inc
LOW
Profitability Risk
MEDIUM
Solvency Risk
MEDIUM
Financial Health Risk
However, while the company's revenue and net income were on the rise, its total debt and liabilities also increased during this period. Total debt rose from $1.39B in 2018 to $2.38B in 2022, a 70.46% change, and liabilities increased from $4.05B in 2018 to $5.75B in 2022, a 41.87% change. Despite this increase in debt and liabilities, the company's cash position saw a significant improvement, rising from $132.6M in 2017 to $702.81M in 2022, a 430.03% increase.
The financial metrics suggest that CGI Inc is in a relatively strong financial position, with a good ability to meet its short-term obligations, as indicated by a current ratio of 1.19. However, there are opportunities for the company to improve its profitability and efficiency in utilizing its assets and equity, as suggested by a gross profit margin of 0.16, net profit margin of 0.11, return on assets (ROA) of 0.1, and return on equity (ROE) of 0.21. The quick ratio of 0.64 is lower than the current ratio, indicating that the company may not have enough quick assets to cover its immediate liabilities, which could be a concern.
Based on the financial details and ratio analysis provided, CGI Inc's financial health has been robust over the past five years, but there are some areas of concern that require further investigation. Although the company's revenue and balance sheet have grown significantly, its total debt and liabilities have also increased at a faster rate. This could potentially be a cause for concern if the company is unable to service its debt obligations as they come due. Additionally, the company's profitability, as indicated by its gross profit margin and net profit margin, is somewhat lower than desired. This could limit the company's ability to generate sufficient cash flow to meet its debt obligations and invest in growth opportunities. Furthermore, the quick ratio, which measures a company's ability to pay its short-term debts with its quick assets, is lower than the current ratio. This suggests that the company may not have enough quick assets to cover its immediate liabilities, which could potentially impact its ability to meet its short-term obligations.
Despite these concerns, the Altman Z-Score of 7.36 indicates a low probability of bankruptcy within the next two years. However, it is essential to continue monitoring the company's financial performance, particularly its liquidity risk, to ensure that it remains in a strong position to weather any economic or market challenges that may arise.
List of UEIs for CGI Inc
ABOUT SUPPLIER FINANCIAL HEALTH REPORTS
Ark provides definitive, consolidated analyses of every vendor, subcontractor, supplier, grant awardee, non-profit, and investment organization in the national security and defense sectors. Supplier financial health reports are AI-assisted analyses of the current health and stability of an organization, as well as the trends, trajectory, and risk indicators that partners and stakeholders need to know about.
Explore Additional Analyses
ABOUT ARK.AI
The Ark is the only software platform purpose-built for Defense Acquisition that leverages authoritative commercial data and AI-enabled Applications designed to solve Acquisition challenges. With the Ark, analysts and decision-makers gain the ability to manage Acquisition programs proactively, allowing them to unwind the legacy complexity and effectively field modern warfighting systems that compete with China.
The Leading Defense Acquisition Software.


OUR APPLICATIONS
AI-enabled Applications within The Ark reflect standard workflows across the Defense Acquisition Process. From Science & Technology to Modernization, these Applications allow for the execution of rapid, efficient, data-informed decisions, standardized reporting, and efficient workflow management. The Ark enables your team to transform Defense Acquisition into a strategic advantage.