CACI International Inc.
Supplier Financial Health Report
Overview
June 2024
USA
Incorporated Country
23,000
Number of Employees
A+
Credit Rating
11.2
Altman Z-Score
Five-Year Financial Trend Analysis for CACI International Inc.
CONSTANT
Credit Trend
103.60%
Total Balance Sheet Growth Rate
1.88%
Total Debt Growth Rate
The annual revenue trend has been on the rise, increasing from $4.99B in 2019 to $6.7B in 2023, representing a 34.42% change. This growth is reflected in the balance sheet, which has seen an increase from $3.24B in 2015 to $6.6B in 2023, a significant 103.60% change. The cash trend has also shown a substantial increase, rising from $35.36M in 2015 to $115.78M in 2023, a 227.38% change.
The net income and EBITDA trends have also shown impressive growth, with net income rising from $126.3M in 2015 to $384.74M in 2023, a 204.63% change, and EBITDA increasing from $463.74M in 2019 to $709.06M in 2023, a 52.90% change. The net operating cash flow trend has followed a similar pattern, increasing from $226.86M in 2015 to $745.55M in 2022, a 223.53% change.
However, the free cash flow trend has shown a decrease, dropping from $507.4M in 2019 to $324.34M in 2023, a 36.08% change. This decrease in free cash flow may indicate that the company is investing heavily in growth or capital expenditures, which could impact its short-term liquidity.
The company's revenue is diversified across various countries, with China contributing the largest share at 0.69% in 2022-2023, followed by Japan, Germany, India, the United Kingdom, France, Italy, Canada, Brazil, and the Russian Federation, each contributing less than 1% of the total revenue.
Despite the impressive financial growth, there are some concerns regarding the decrease in operating cash flow per share from $21.87 in 2019 to $16.57 in 2023, a 24.20% change. This decrease could impact the company's ability to distribute cash to its shareholders and may indicate a shift in the company's focus towards growth over profitability.
In conclusion, CACI International Inc. has shown a strong financial health with impressive revenue and balance sheet growth, excellent creditworthiness, and a stable credit trend. However, the decrease in free cash flow and operating cash flow per share may indicate some challenges in managing cash flows and distributing profits to shareholders. Further analysis of the company's financial statements and business strategy would be necessary to fully assess its financial health and investment potential.
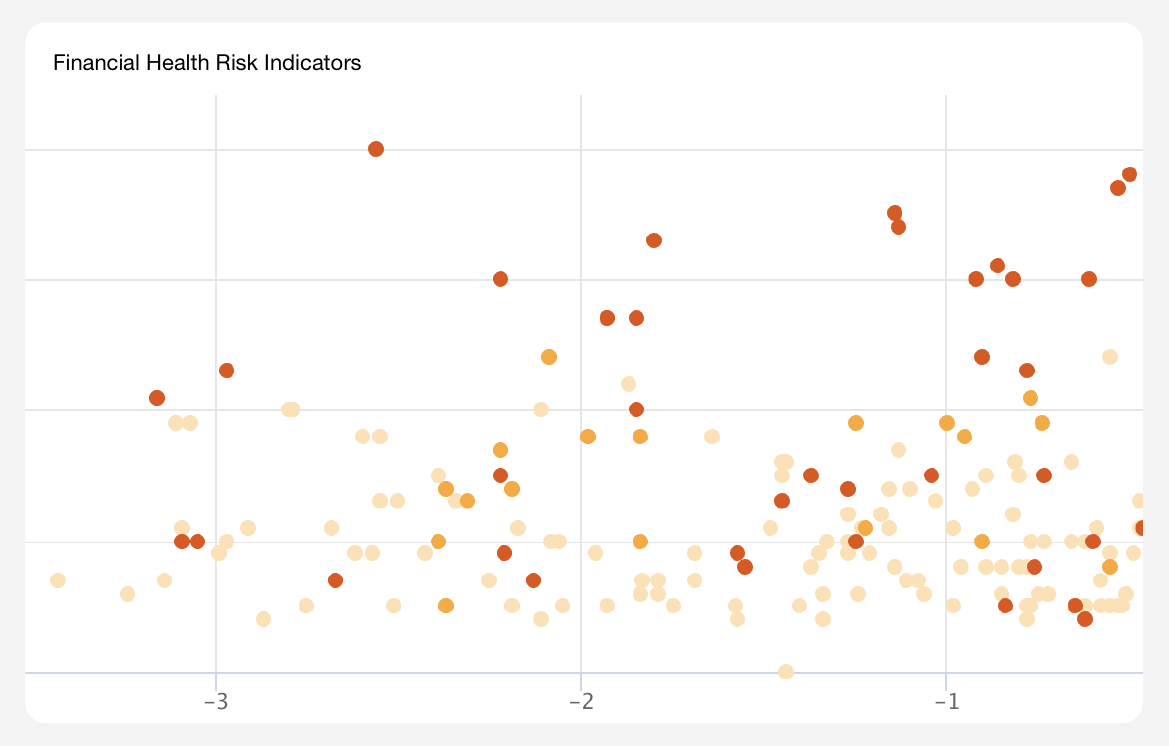
Financial Health Risk Assessment for CACI International Inc.
LOW
Credit Risk
LOW
Bankruptcy Risk
MEDIUM
Financial Health Risk
However, there are some areas of concern that merit further investigation. The decrease in free cash flow from $507.4M in 2019 to $324.34M in 2023 indicates that the company may be investing heavily in growth or capital expenditures, which could impact its short-term liquidity. Additionally, the operating cash flow per share has decreased from $21.87 in 2019 to $16.57 in 2023, which could impact the company's ability to distribute cash to its shareholders and may indicate a shift in focus towards growth over profitability. These trends should be closely monitored to assess their potential impact on the company's financial health.
Furthermore, while the Altman Z-Score of 11.2 indicates a very low probability of bankruptcy within the next two years, it is important to note that this score alone should not be the sole determinant of a company's financial health. A more comprehensive analysis of the company's financial statements and business strategy would be necessary to fully assess its financial health and investment potential.
The company's revenue is diversified across various countries, with China contributing the largest share at 0.69% in 2022-2023. The company's financial health ratios, such as the current ratio, quick ratio, debt ratio, debt-to-equity ratio, gross profit margin, net profit margin, return on assets, return on equity, and Altman Z-Score, all suggest a solid financial position, with strong liquidity, moderate use of debt, and a low probability of bankruptcy.
In conclusion, CACI International Inc. has shown a strong financial health with impressive revenue and balance sheet growth, excellent creditworthiness, and a stable credit trend. However, the decrease in free cash flow and operating cash flow per share may indicate some challenges in managing cash flows and distributing profits to shareholders. Further analysis of the company's financial statements and business strategy would be necessary to fully assess its financial health and investment potential.
List of UEIs for CACI International Inc.
ABOUT SUPPLIER FINANCIAL HEALTH REPORTS
Ark provides definitive, consolidated analyses of every vendor, subcontractor, supplier, grant awardee, non-profit, and investment organization in the national security and defense sectors. Supplier financial health reports are AI-assisted analyses of the current health and stability of an organization, as well as the trends, trajectory, and risk indicators that partners and stakeholders need to know about.
Explore Additional Analyses
ABOUT ARK.AI
The Ark is the only software platform purpose-built for Defense Acquisition that leverages authoritative commercial data and AI-enabled Applications designed to solve Acquisition challenges. With the Ark, analysts and decision-makers gain the ability to manage Acquisition programs proactively, allowing them to unwind the legacy complexity and effectively field modern warfighting systems that compete with China.
The Leading Defense Acquisition Software.


OUR APPLICATIONS
AI-enabled Applications within The Ark reflect standard workflows across the Defense Acquisition Process. From Science & Technology to Modernization, these Applications allow for the execution of rapid, efficient, data-informed decisions, standardized reporting, and efficient workflow management. The Ark enables your team to transform Defense Acquisition into a strategic advantage.